
Consumer Spec - Pre Market Wrap
MNST (+), TXRH (+), ATZ CN (+), WYNN (-), DKNG (-), SG (-), FBIN (-), FIGS (-), REAL (-), WEN (+) | Athleisure Downgrades, WHR Dividend Suspended, PLNT Double-Downgrade, Tariff Ruling, Brent $100, MAT

US equities are trading higher this morning, supported by signs that the Iran ceasefire is still holding despite Thursday’s exchange of fire, which Trump downplayed as a “love tap.”
The Section 122 tariff ruling is also a modest positive, though the near-term corporate impact should be limited. If anything, the decision may push the White House to move faster on a new round of import taxes with stronger legal footing. Overnight economic data did little to change the broader macro narrative, while monetary policy headlines remained relatively quiet.
Consumer Pre-Market
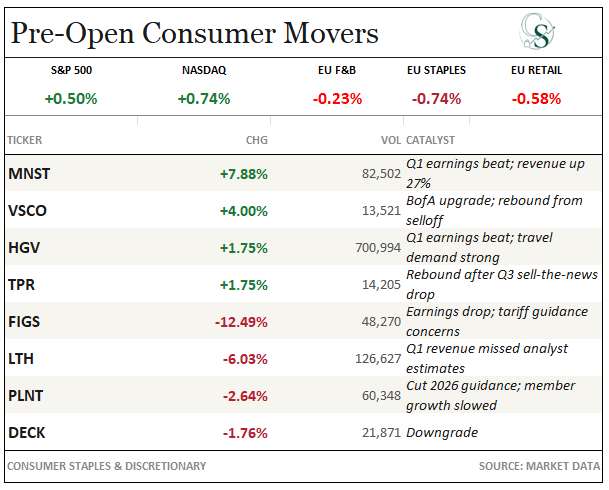
Consumer earnings this morning highlighted by beats from MNST (+8%), TXRH (+5%) and ATZ CN. Others like WYNN (-1%), DKNG (-1%), SG (-1%) are more mixed while FBIN (-2%) again highlighted the challenging housing environment
Quiet morning on the tape, but plenty of pain underneath. Wells Fargo turns hard against Athleisure — downgrading NKE to EW and DECK to UW, while flipping VSCO to OW. Mizuho takes a knife to WHR ($45 PT) after a brutal 1Q miss with NA appliance industry -7.4% and US consumer sentiment at ~50-yr lows on the Iran war. MCD PT cut to $300; SHAK triple-tagged ($100/$100/Stifel upgrade). PLNT loses two bulls (TDCowen, MS) on saturation and pricing pushback.
Bright spots: TPR upgraded at UBS ($187), RL PT raised to $450 at BTIG. Macro overhang: US trade court struck down Trump’s 10% global tariff; Brent topped $100 on renewed Gulf clashes.
STREET RESEARCH
Upgrades
Cedar Fair (FUN) Raised to Neutral at JPMorgan
Shake Shack (SHAK) Raised to Buy at Stifel
Tapestry (TPR) Raised to Buy at UBS
Victoria’s Secret (VSCO) Raised to Overweight at Wells Fargo
Downgrades
Deckers Outdoor (DECK) Cut to Underweight at Wells Fargo
Nike (NKE) Cut to Equal Weight at Wells Fargo
Planet Fitness (PLNT) Cut to Hold at TD Cowen
Planet Fitness (PLNT) Cut to Neutral at BofA
Planet Fitness (PLNT) Cut to Equal Weight at Morgan Stanley
Vital Farms (VITL) Cut to Market Perform at Telsey
Vital Farms (VITL) Cut to Hold at Stifel
Initiations
No consumer sector initiations today.
Earnings Reports
MNST +8%: BIG TOPLINE BEAT WITH EPS UPSIDE, GM MISS BUT IN-LINE WITH WHISPER, APRIL QTD TRENDS REMAIN VERY STRONG; SELL-SIDE BAR LIFTED POST-PRINT.
Good print on one of the top consumer names.
Revenue $2.353B, +26.9% reported / +22.1% organic (Q4’25 OSG +17.6%) vs Street OSG +14.7% — ~740 bps beat.
US OSG +15.1% vs Street +12.2%; Int’l OSG +32.7% vs Street +18.9%. GM 55.0%, -155 bps y/y, missed consensus by ~45 bps but landed at sell-side model. April QTD OSG +21.6% (+18.5% on a 2-yr basis) signals momentum is sustaining post-Iran conflict noise. Mgmt called aluminum/tariff impact “modest” — better than feared.
1. Key Takeaways
Topline blew out the quarter — +22.1% OSG vs Street +14.7%, with international (+32.7%) far ahead of +18.9% expectation. International now a record 45% of mix vs 41% in 2025 and 32% pre-COVID.
GM optics worse than reality — -45 bps miss vs consensus, but the Street number was viewed as stale; the underlying -180 bps adj GM y/y (ex-alcohol) was driven by ~120 bps of geographic mix headwind (good problem) plus aluminum and out-of-orbit freight from demand outrunning capacity.
Tariff/aluminum commentary the read-through — mgmt expects “modest” sequential cost step-up through YE26 from current Midwest premium levels; this is the key macro tell vs broader CPG fears post-Iran. MNST exposure is Midwest premium driven, so less correlated to oil pullback.
April trends sustain the thesis — +21.6% QTD on a +18.5% 2-yr basis. 22% L4M OSG / 13% 2-yr L4M OSG is the cleanest evidence the growth profile is structurally above CPG peers.
Innovation pipeline characterized as best in 20+ years — US: FLRT, Storm, America 250 Ultra, Lando Norris Zero, Strawberry Dreams; EMEA: Viking Berry called “most successful launch ever” in region; affordable energy (Predator, Fury) expanding across MEA, China, India.
International share gains re-accelerating — Q1’26 monster brand retail energy value share +7.0% y/y, the third consecutive quarter above +5% after the 1Q24-2Q24 lull.
MS PT to $100 from $96 on ~33x 2028 EPS / ~37x CY27e P/E; estimates +1% on ‘26/’27.
2. KPIs vs. Street
Revenue: $2.353B, +26.9% reported, +22.1% organic (Q4’25 OSG +17.6%) vs Street OSG +14.7%; +9.3% revenue beat vs consensus.
US OSG: +15.1% vs Street +12.2%. US share losses dissipating sequentially ahead of the heavy 2026 innovation slate.
International OSG: +32.7% vs Street +18.9%. EMEA +36.5% local FX, APAC +36.7%, Oceania +42.1%, LatAm +22.3%. Mix at record 45% of sales.
Gross Margin: 55.0% (-155 bps y/y reported / -180 bps adj ex-alcohol) vs consensus ~55.4%; -45 bps miss. Geographic mix ~120 bps drag, aluminum ~under 100 bps drag, partially offset by pricing.
Opex % sales: -85 bps below expectations, the source of EPS leverage.
Operating Income: +12.0% beat vs consensus; OP margin 30.8%.
Price/Volume Mix: Volume the dominant driver, with pricing supportive and building via RGM (revenue growth management). Pricing called out as above CPG peer set.
Forward Guide / Outlook: No formal numeric guide; mgmt commentary points to “modest” sequential GM pressure through YE26 from aluminum/Midwest premium, no material tariff impact expected. April +21.6% QTD is the de facto topline data point.
Inventory: Out-of-orbit production cited — i.e., demand running ahead of normal capacity, implying lean channel inventory rather than overhang. Net positive read.
3. Bull vs. Bear Debate
Bulls view MNST as a structurally unique CPG asset — the only large-cap staple delivering durable double-digit OSG against a peer set largely stuck at LSD-MSD. The category itself is growing via favorable demographics and rising per-capita consumption, MNST is taking share both internationally (where it’s still under-penetrated) and stabilizing in the US, and RGM is now layering pricing on top of what has historically been a volume story. International at 45% of mix is the key — bulls expect a 17% int’l revenue CAGR to drive two-thirds of the 12% corporate CAGR over five years, with international margins simultaneously inflecting on zero-sugar mix shift, scale, and the affordable energy platform (Predator, Fury) opening LDA, MEA, China, India.
This quarter unambiguously added to the bull case. +22.1% OSG vs +14.7% Street is a 740 bps beat, April +21.6% removes the “easy comp flatter” pushback, and mgmt’s “modest” tariff/aluminum framing defuses the biggest macro overhang. The “best innovation pipeline in 20+ years” comment from sell-side coverage is the qualitative cherry. Bull math: ~$10.8B CY27 revenue × low-teens growth into CY28 gets you ~$12.3B; at ~37x CY27e EPS of ~$2.70 = $100 base, ~44x bull EPS = $125. Stretched bull case at sustained mid-teens OSG with margin recapture argues stock could earn ~33x 2028 EPS of ~$3.06 = ~$100+ in 12-18 months on the long end.
Bears push back on valuation and durability. At ~32x 2026e and ~28x 2027e EPS, MNST trades at a meaningful premium to staples even adjusting for growth, and the bull thesis requires continued international outperformance against a backdrop where Coke Energy, Celsius, and a long tail of regional brands are all targeting the same shelf. US share losses have only “dissipated” sequentially, not reversed, and the GM trajectory is still negative on mix — Q1’26 adj GM down 180 bps y/y is not nothing, and forward “modest” cost pressure through YE26 means margins likely don’t inflect this year. International margin expansion is a thesis input that hasn’t fully shown up yet in LatAm (44.1% vs 44.6%).
What Changed This Quarter: The growth durability question got harder for bears to argue. April tracking +21.6% on a 2-yr +18.5% basis, after lapping a tough comp and through Iran-related noise, is the cleanest evidence yet that this isn’t comp-flattered. International at 45% of mix means the higher-growth, higher-incremental-margin business is now the majority driver. Tariff/aluminum framing as “modest” through YE26 takes a tail risk off the table. Negative: GM trajectory remains a 2026 story, not a 2026 inflection; valuation has caught up.
WYNN -1%: IN-LINE HEADLINE — TOP-LINE BEAT, EBITDAR SLIGHT MISS ON WEAK MACAU HOLD, VEGAS CRUSHED IT AGAIN, UAE PUSHED TO 2027
Muted expectations here, takeaways include stronger results in Vegas though cost pressures could have impact going forward, Macau largely inline if adjusted for hold and Wynn Al Marjan construction ongoing though overhang could persist
Revenue $1.857B, +9.2% y/y vs Street $1.824B / sell-side $1.862B (+2bps beat vs cons, ~in-line vs sell-side).
Property EBITDAR $562m vs Street $565m / sell-side $574m — ~$13m sell-side miss but hold-adj would have been in-line (~$17m VIP hold headwind quantified).
Vegas EBITDAR $233m (+4% y/y) beat sell-side $218m by ~7%; Macau EBITDAR $279m (+11% y/y, +18% hold-adj) missed; Boston $51m (-12% y/y) missed on weather/costs. Stock at ~10x 2026e EV/EBITDAR vs ~13x pre-COVID NTM avg.
1. Key Takeaways
Vegas the star again — best March in property history, table drop +17% y/y, April trends sustained with handle, slots, and ADRs all positive. This is the third consecutive quarter Vegas has beaten on high-end share gains.
Macau optically light, hold-adjusted clean — both VIP and Mass hold ran low, ~$17m VIP headwind quantified; mass drop up y/y in April signals underlying demand intact.
UAE pushed to 2027 from 1Q27 prior — mgmt cited Middle East geopolitical conflict and acknowledged “limited visibility.” This is the negative read-through and the main reason expected reaction is muted.
New Cotai growth project announced — Wynn Enclave — ~430-key suite tower (~50% suite increase at Wynn Palace), ~$925m cost, ~2.5 yr build (~2029 open), ~17% cash-on-cash return ($150-175m EBITDA contribution). Partial offset to UAE delay narrative.
Boston a one-quarter hiccup — weather and higher costs, not structural; mgmt framing supports snap-back.
Setup tomorrow: in-line headline + UAE delay = muted reaction expected; valuation cushion at 10x vs 13x pre-COVID is the bull anchor.
2. KPIs vs. Street
Total Revenue: $1.857B, +9.2% y/y (Q4’25 cadence implied stronger) vs Street $1.824B / sell-side $1.862B.
Total Property EBITDAR: $562m, +5.5% y/y vs Street $565m / sell-side $574m. Hold-adjusted in-line.
Las Vegas Revenue: $662m vs sell-side $644m, +5.8% y/y. EBITDAR $233m vs sell-side $218m (+6.6% beat). Table drop +17% y/y, ADRs positive.
Wynn Macau (Peninsula) Revenue: $330m vs sell-side $374m (-11.8% miss). EBITDAR $76m vs sell-side $101m (-25% miss) on weak hold.
Wynn Cotai (Palace) Revenue: $659m vs sell-side $630m (+4.7% beat). EBITDAR $204m vs sell-side $198m (+3.0% beat).
Combined Macau EBITDAR: $279m, +11% reported / +18% hold-adj y/y.
Boston EBITDAR: $51m vs sell-side $59m (-13.7% miss), -12% y/y on weather/cost.
Corporate Expense: $35m vs sell-side $37m (-6.7% — small tailwind).
Forward Guide: No formal numeric guide. April commentary: Vegas handle/slots/ADRs all positive; Macau mass drop up y/y. Capex: Wynn Enclave ~$925m over ~2.5 yrs; UAE opening slipped to 2027 (no quantified delta).
3. Bull vs. Bear Debate
Bulls see WYNN as a high-end-customer franchise trading at a structural discount with multiple uncovered growth options. The thesis rests on: (1) Vegas durability — the property continues to take share at the top end and has now strung together a multi-quarter beat run, with table drop +17% in Q1 and April momentum continuing; (2) Macau premium mass recovery — WYNN’s operating model is built around the high-margin premium customer, and hold-adjusted Macau was in-line, suggesting the underlying demand picture is fine; (3) free options on UAE and now Wynn Enclave that aren’t in numbers.
This quarter added to the bull case on Vegas (clean beat, best March ever, April carry-through) and the Enclave announcement (a tangible Macau growth project at 17% cash-on-cash returns). It subtracted on UAE timing slipping to 2027 with mgmt explicitly flagging limited visibility, and Boston’s miss (even if weather-driven). Bull math: ~$2.4B 2027e property EBITDAR × 11x (modest re-rate from 10x toward 13x pre-COVID) = ~$26B EV, plus $8 LV land + $23 UAE dev + $2 UAE land = ~$160-165 sum-of-parts. MS PT $136 sits between base (~10x) and bull on multiple expansion alone.
Bears point to a structurally higher-risk earnings stream and capex burden with no near-term EBITDA contribution to offset. Macau hold normalization isn’t predictable, the Chinese consumer/Macau GGR recovery has been choppy, and Boston is now in the portfolio dragging the multiple. UAE was supposed to be the next leg of growth and just slipped a year with mgmt admitting limited visibility — that’s not a one-time delay risk, that’s an open-ended one in a region that just had a geopolitical conflict.
What Changed This Quarter: Vegas durability got reinforced (third strong print in a row, April carrying), the Macau growth pipeline got a concrete addition (Enclave at 17% cash-on-cash), and the UAE optionality got pushed out and de-risked downward. Net the bull case still works on valuation (10x vs 13x pre-COVID), but the patience required just got longer.
FIGS -15%: CLEAN REVENUE BEAT WITH ACTIVE CUSTOMER ACCELERATION, EBITDA BEAT GUIDE BUT FLOW-THROUGH LIGHT ON COST PRESSURE, FY26 GUIDE RAISED ON BOTH TOP-LINE AND MARGIN
Stock coming back to pre-earnings gap levels from last quarter earnings surprise.
Revenue $159.9M, +28.0% y/y (Q4’25 +33%) vs Street $153.1M / sell-side $153.5M — ~4% beat.
Adj EBITDA $13.9M / 8.7% margin vs Street/sell-side $11.1M, ~170 bps above mgmt guide. Active customers 3.0M (+12% y/y, accelerating from +8% in Q4’25), AOV $124 (+4% y/y). GM 67.7% (+11 bps y/y). FY26 guide raised: revenue +14-16% (from +10-12%), adj EBITDA margin 13.0-13.2% (from 12.7-12.9%).
1. Key Takeaways
Top-line broad-based — US +24.1% y/y, international +49.9% y/y; non-scrubwear accelerated to +31% y/y, scrubwear +27% y/y. International remains the standout growth vector.
Active customer growth re-accelerated — 3.024M (+12% y/y) vs +8% exiting 2025, with strong purchase frequency driving rev/active customer higher. This is the cleanest signal that brand momentum is intact.
GM expansion modest at +11 bps y/y to 67.7% — pricing/efficiency tailwinds offset by tariff pressure and product mix shift; FY GM guide maintained at “modest improvement from 66.5%” despite slightly lower tariff headwinds (offset by higher freight).
Marketing spend stepped up to 18.4% of sales (vs 14.5% in 1Q25, 14.0% in 4Q25) — the source of the EBITDA flow-through pressure; mgmt framed as strategic investment, will leverage from 1Q levels through FY.
2H compares toughen materially — explicit caution from sell-side that the raise is “measured” because of this; 2Q guide low-20% rev growth, ~13.5% adj EBITDA margin, modest GM decline.
Tax guide cut to ~20% from ~25% — quiet tailwind to EPS.
Stock at $15.37, up 214% y/y, vs sell-side PT $19 (+24% upside). Trades at 24.7x 2027e EV/EBITDA / 3.5x EV/sales vs apparel/e-comm peers at 10.7x / 1.1x — premium is the debate.
2. Bull vs. Bear Debate
Bulls view FIGS as a category-defining DTC brand with a long runway in scrubs internationally, multiple adjacent product/channel optionalities (TEAMS, Community Hubs, lifestyle/non-scrubwear), and a customer cohort behavior pattern that finally re-accelerated this quarter after a 2024 lull. The thesis is that healthcare apparel is a structurally underpenetrated category, FIGS owns the premium tier, and the international ramp (+50% y/y this quarter) is still in early innings — particularly in markets where the brand only recently launched. The active customer +12% print combined with rising frequency is exactly the data bulls needed to defend the multiple.
Bears push back hard on valuation: 24.7x 2027e EV/EBITDA and 3.5x EV/sales is more than 2x the apparel/e-comm peer group on every multiple. The stock is +214% y/y, has captured a lot of the re-rating already, and now trades at a level that requires sustained 15%+ revenue growth and margin expansion to work. Marketing spend stepped up materially this quarter (18.4% of sales vs 14.5% LY) and mgmt is explicitly leaning into “strategic investments” — the bear read is that customer growth is being bought, not earned, and incremental marketing efficiency is deteriorating.
What Changed This Quarter: Active customer growth re-accelerated meaningfully (+12% from +8%), international stayed at ~50% growth, FY guide moved up on both lines, and tax cut to 20%. Negatives: marketing spend stepped up sharply, non-scrubwear is a lower-GM mix headwind, and 2H comps remain the bear’s structural argument. Net positive for thesis but valuation cushion is thin — the multiple has to stay near current to make the math work.
REAL -8%: CLEAN REVENUE BEAT DRIVEN BY AOV/GMV STRENGTH, EBITDA SOLID ON OPEX LEVERAGE, FY26 GUIDE RAISED; TAKE-RATE COMPRESSION THE OFFSET AS MGMT LEANS INTO HIGHER-VALUE MIX
Quarter was solid but move pre market reflects high expectations and guidance/cadence concerns
Revenue $189.7M, +19% y/y (Q4’25 $194.1M / +21%) vs Street $170.3M / sell-side $189.0M — ~11% beat vs Street, in-line vs sell-side.
GMV $606M, +24% y/y (Q4’25 +22%) — accelerating.
Adj EBITDA $13.1M / 6.9% margin (Q4’25 $21.9M / 11.3% — seasonal) vs sell-side $14.0M, slight miss. Take rate 36.4%, -220 bps y/y on mix. FY26 guide raised: GMV $2.42-2.45B (from $2.39-2.45B), revenue $770-784M (from $765-780M), adj EBITDA $59-67M (from $57-65M).
Key Takeaways
GMV +24% accelerating from +22% in Q4’25 — the cleanest signal that the marketplace flywheel is intact and gaining speed; both sides of the platform growing.
Active buyers +10% y/y to 1.083M — fastest growth print in the multi-quarter series shown (vs +9% Q4’25, +5% Q1’25). 43% of new consignors originated from active buyers, validating the flywheel mechanics.
AOV double-digit growth, the dominant driver — order growth +7.9% but AOV doing the heavy lifting; mgmt explicitly leaning into higher-value supply.
Take rate -220 bps to 36.4% is by design, not weakness — mgmt framed as deliberate trade-off: NT take-rate pressure for higher absolute profit dollars on higher-value items. This is the key narrative point and the bear’s ammunition.
Opex leverage broad-based — Ops & Tech 37.3% of sales (-320 bps y/y), SG&A 25.5% (-270 bps y/y), Marketing roughly flat at 9.6%. AI/automation cited as a contributor.
Athena rollout target: 50% of inventory by YE26 across mid- and high-value items; ops/tech remains the largest 2026 margin lever.
FCF benefit from working capital expected in 2H26.
Stock at $12.40, +70% y/y but -17.6% YTD — well off recent highs; sell-side PT $20 (+61% upside).
What Changed This Quarter: Marketplace flywheel data points all moved in the right direction (GMV accelerating, active buyers accelerating, consignor sourcing efficient at 43% from buyers), opex leverage was broad-based, and FY guide moved up. Negatives: take-rate compression deeper than expected, EBITDA absolute dollars missed sell-side, and 2Q sequential margin compression telegraphed. Net incrementally positive but the take-rate narrative is now the central debate going forward.
WEN +4.3%: SOLID QUARTER BUT NEED TO SEE US SSS ACCELERATING FOR THE TURNAROUND STORY GET TRACTION
FIRST QUARTER RESULTS
Adjusted EPS 12c vs. 20c y/y, estimate 9.8c (Bloomberg Consensus)
Adjusted Ebitda $111.3 million, -11% y/y, estimate $102.7 million
Revenue $540.6 million, +3.3% y/y, estimate $517.7 million
Franchise royalty revenue $116.2 million, -4.5% y/y, estimate $115.6 million
Franchise fees $31.7 million, +35% y/y, estimate $23.2 million
Franchise rental income $58.9 million, +0.8% y/y, estimate $57 million
Advertising funds revenue $108.3 million, +8% y/y, estimate $95.5 million
Global comp. sales -6.8% vs. -2.1% y/y, estimate -5.72%
US comparable sales -7.8% vs. -2.8% y/y, estimate -6.61%
International comparable sales -0.4% vs. +2.3% y/y, estimate +1.26%
Global systemwide sales $3.22 billion, -90% y/y, estimate $3.22 billion
U.S. Company-Operated Restaurant Margin 11.4%, estimate 11.6%
YEAR FORECAST
Still sees adjusted EPS 56c to 60c, estimate 57c
Still sees free cash flow $190 million to $205 million, estimate $188.3 million
Still sees global systemwide sales about 0%
Still sees adjusted Ebitda $460 million to $480 million, estimate $467.3 million
Still sees capital expenditure $120 million to $130 million
COMMENTARY AND CONTEXT
Reaffirms Year 2026 Outlook
“Our international business continues to deliver strong results, with systemwide sales up 6.0% in the quarter supported by further expansion in key growth markets.”
“While our first quarter results reflect a business in the early stages of a turnaround, we are making progress to improve our U.S. business and are confident in the direction we are heading.”
Analyst Actions
MAT: MATTEL ACTIVIST LETTER FROM SOUTHEASTERN REOPENS STRATEGIC DEBATE; JEFFERIES REITERATES BUY ON IP OPTIONALITY
Southeastern Asset Management issued an open letter pressing Mattel to explore strategic alternatives, arguing public markets undervalue the company’s stable cash generation and IP portfolio.
The letter outlines three potential buyer categories — private equity, strategic toy peers, and large media companies — and explicitly names Hasbro as the most logical strategic combination. Mattel responded briefly, reaffirming its strategy and board oversight.
Jefferies views PE optionality as credible given seasonality-driven public-market discount, sees media interest as strategically sound but constrained by post-streaming balance sheets, and views a Hasbro takeout as unlikely. Hybrid carve-out structures across IP, content, and core physical toys are seen as more realistic than an outright sale. Activism may cap downside and revive optionality.
SHAK: STIFEL UPGRADES TO BUY ON TROUGH VALUATION
Stifel upgrade SHAK to Buy from Hold (PT to $85 from $105) on 10-yr valuation lows at ~12.5x NTM EBITDA — COVID-trough levels — with low-teens unit growth and meaningful G&A leverage opportunity beyond 2026’s ~4% EBIT margin. Stifel argue the brand’s cultural relevance and EBITDA growth algorithm of low-mid teens make this an attractive entry for >3-6 month duration investors.
PLNT: TD COWEN AND MORGAN STANLEY BOTH DOWNGRADE; PTS SLASHED TO $50 AND $47 RESPECTIVELY
PLNT double-downgraded as the bull case unwinds. TD Cowen cut to Hold from Buy with PT to $50 from $90 on four concerns: (1) marketing fixes targeting first-time members will take until 2027 to fully materialize given size and maturity; (2) intensifying national competitive threats versus PLNT’s slow-to-scale value prop; (3) saturation-driven member losses at mature gyms stressing the system; and (4) risk to out-year openings as the removed Black Card price hike hurts new-box returns and franchisee returns.
Morgan Stanley moved to Equalweight from Overweight with PT slashed to $47 from $117, citing disproven bull tenets including no pricing visibility post-Black Card pushback, headwinds to club growth without unit-economics improvement, and credibility damage from the pace and magnitude of recent guidance reductions leaving an investor overhang on forward expectations. MS sees PLNT fairly valued at ~14-15x 2027 EPS and ~9x 2027 adj. EBITDA. Bull case (+94%) requires regaining momentum on the marketing reset; bear case (-59%) widens on secular pricing pressure from new low-priced competitors and the introduction of dynamic pricing in the category.
NKE: WELLS FARGO DOWNGRADES TO EQUAL WEIGHT FROM OW, PT TO $45 FROM $55
Wells Fargo downgraded Nike to Equal Weight from Overweight with a price target of $45, down from $55. Wells says that as the largest footwear company globally, Nike does not fit with its preference of clothing outperforming over the next few years. The broader shift away from athletic apparel and the “over-saturation” of the market from excess competition create fundamental challenges for Nike, the analyst tells investors in a research note. Wells says the global Nike turnaround is taking longer and international disruption is likely to weigh on its results near-term.
DECK: WELLS FARGO DOWNGRADES TO UNDERWEIGHT FROM EQUAL WEIGHT, PT CUT TO $90 FROM $115
The firm says Deckers is the most heavily concentrated footwear company under its coverage. The company is not likely to be a benefactor of the GLP-1 tailwind that will benefit apparel names, the analyst tells investors in a research note. Wells sees a multi-year trend that will lead to Deckers underperformance on a relative basis to apparel. It also sees risk to the company from actions Nike is taking in order to recapture lost share in specialty run.
MCD: MIZUHO LOWERS PT TO $300 ON IRAN WAR PRESSURE TO LOWER-INCOME CONSUMER
MCD PT lowered to $300 from $310 at Mizuho (Neutral). Aggressive value plus barbell innovation drove a largely in-line US comp in Q1, but Q2-to-date commentary points to negative April SSS in both US and IOM, fanning fears around the Iran War’s impact on the consumer (particularly lower-income). Mizuho remains skeptical Q1 comp strength is sustainable through the rest of ‘26 against tougher YoY compares and continued QSR (lower-income) customer pressure. Risk to 2026 margin expectations remains elevated. 2026 EPS estimate maintained at $13.06; 2027 EPS lowered to $14.16 from $14.24.
VSCO: WELLS FARGO UPGRADES TO OVERWEIGHT FROM EQUAL WEIGHT, PT TO $57 FROM $55
Wells Fargo upgraded Victoria’s Secret to Overweight from Equal Weight and raised its price target to $57 from $55. The firm’s analysis suggests that GLP-1 adoption is driving a multi-year demand tailwind for U.S. apparel. Wells Fargo is also constructive on Victoria’s Secret’s business trajectory under the new management team. The analyst highlighted the company’s repositioning back toward “sexy” branding, along with improved marketing campaigns, as key factors supporting the upgrade.
WYNN: CITI LOWERS PT TO $132 FROM $145, MAINTAINS BUY ON MACAU EXPOSURE
Citi’s James Hardiman lowered the PT on WYNN to $132 from $145 while maintaining a Buy rating. The cut reflects broader caution on Macau-exposed gaming names amid regional travel uncertainty and Middle East-related consumer headwinds rippling through luxury/leisure spend, though Citi remains constructive on the long-term Macau recovery and the US development pipeline.
WHR: MIZUHO CUTS PT TO $45 ON BRUTAL 1Q MISS, DIVIDEND SUSPENDED, GUIDE SLASHED
Mizuho lowered WHR PT to $45 from $55 (Neutral) following a sharp 1Q miss — adj. EPS came in at -$0.56 vs. +$0.36 consensus. NA appliance industry was -7.4% (March -10%, “GFC-like”) as the Iran war collapsed US consumer sentiment to ~50-yr lows. MDA NA EBIT margin only 0.3% on volume/mix/inventory drawdown costs. FY26 EBIT margin guide cut to ~4% from 5.5-5.8%; NA MDA EBIT margin to ~4.0% from ~6.0%. FY26 EPS slashed to $3.00-$3.50 from $7.00; common dividend SUSPENDED. Mizuho’s 2026E now $2.74 (from $5.15), 2027E $5.28 (from $6.20). Highlights the depth of damage to discretionary big-ticket consumer demand under current macro stress.
RL: BTIG RAISES PT TO $450 FROM $435 AHEAD OF RESULTS, BROAD-BASED STRENGTH SEEN
The firm raises RL PT to $450 (25x CY27E EPS) from $435 ahead of 4Q26 results (5/21 BMO), forecasting $1.830B in sales (+7.9% YoY) and adj. EPS of $2.41 with broad-based strength, robust full-price sell-through, and roughly flat GM as ~150-180bps of tariff headwinds peak in Q4.
The analyst notes North America should deliver another ~+8% comp on Winter Olympics/Team USA hockey and MLB Yankees-driven brand momentum plus structural improvements (~75% reduction in US off-price shipments, ~⅔ rationalization of lower-tier wholesale doors, ~27% full-price store expansion since FY18 driving AUR >100% higher and segment margin to high-20%s), while Europe should reaccelerate to ~+5% c/c comps from flat last quarter despite 4Q wholesale timing/tough comp drag. The analyst adds drivers include China cultural tailwinds (Year of the Horse), acceleration in women's, outerwear and handbags, and continued HSD-LDD AUR growth; FY27 estimates held at $8.558B sales (+7.4%) and $18.00 adj. EPS, with the stock at ~$360 trading ~20x forward and supported by 31%/11% FY26E/FY27E EPS growth and >$650M YTD FCF / ~$500M returned in FY26.
TPR: UBS UPGRADES TO BUY FROM NEUTRAL, PT RAISED TO $187 FROM $142, AI WINNER
UBS’s Jay Sole upgraded TPR to Buy from Neutral with PT to $187 from $142. Four-pillar thesis: (1) successful new-customer acquisition, particularly Gen-Z, ahead of expectations; (2) Coach ramping rapidly in Greater China; (3) improved Coach sales sustainability via TAM expansion; (4) TPR a top AI deployer per UBS analysis. UBS raised its 4-year EPS forecast to 13.5% from 5%; FY27/FY28 EPS now 13%/17% above consensus. UBS views the 12% post-3Q26 pullback as an attractive entry at 14x FY28 EPS.
MORGAN STANLEY CRUISE REPORT: CHANNEL CHECKS SHOW BIFURCATED CRUISE DEMAND; CCL AND VIK PREFERRED
Morgan Stanley’s monthly checks point to a still-bifurcated and somewhat softer US cruise market, with luxury and “safe haven” itineraries (Alaska, New England, Canada, Caribbean, Nordics, Japan/Asia, private island, polar/expedition) holding up while mainstream and EU-exposed product softens, several agents flagging April bookings down 18% to 35% with heavier promotional intensity, smaller deposits and close-in discounting that imply weaker net pricing than headline fares suggest.
The firm says the luxury-focused agent is still running 30% YoY booking growth with prime summer 2026 effectively sold out, and brand-level checks show relative strength at Celebrity, Princess, Holland America, Oceania and ultra-luxury, while Viking, Royal Caribbean and Carnival saw discounting in some channels. The analyst adds that NCLH’s 400bps yield guide cut (to -4% from 0%) implies a mid-teens drop on remaining inventory but appears largely self-inflicted given management explicitly cited revenue management, marketing and commercial execution issues, with RCL’s more recent commentary describing healthy consumer trends, record booked pricing, only localized Med/Mexico softness already rebounding, and a better-than-feared 100bps FY yield cut to 1.5-2.5%. Stay Overweight CCL (FY27e 9% FCF yield, 11x P/E, $14B planned cash return = 40% of mkt cap) and VIK (best growth/visibility/buyback optionality); Equal-weight RCL and NCLH.
COWEN FURNITURE PREVIEW: 1Q HOME IMPROVEMENT & FURNITURE PREVIEW; CONSTRUCTIVE ON HD, LOW, WSM
TD Cowen says positioning is light into 1Q across Home Improvement and furniture, with results likely better than feared at HD/LOW, strongest at WSM, and soft at RH.
The firm notes HI ticket should drive comps while transactions stay pressured but better than feared on stable break-fix spend offset by weak discretionary projects (low consumer confidence, low existing home sales, luxury a bright spot); HD bogeys sit at +0.5-1% US comps with focus on Complex Pro software scaling and M&A integration, while LOW bogeys are +1-1.5% and should outpace HD for a 3rd straight quarter on better seasonal, tax refund benefit, and stronger Pro/R&R demand, with both expected to reiterate FY guides and 2H setups looking more attractive on easier laps. The analyst adds WSM bogey is 3%+ comps with EBIT margin above Street and the recent sell-off offers an attractive near-term entry despite valuation debate, while RH remains challenged with skepticism on FY guide achievability post a softer 1Q/likely 2Q, though successful Estates launch (and Europe) could drive 2024-style upside.
Macro & News
TARIFFS: US TRADE COURT RULES AGAINST TRUMP’S 10% GLOBAL TARIFF, MAJOR CONSUMER READ-THROUGH
The U.S. Trade Court Thursday ruled across-the-board tariffs are not justified under 1970s-era laws — striking down Trump’s 10% global tariff. Material read-through for soft-lines, footwear, toys, home furnishings, and HPC where tariff drag has been a key 2026 estimate-cut driver. Watch for second-derivative reactions on NKE, DECK, RL, GAP, AEO, ANF, HAS, MAT, WSM, RH, WHR, WMT, TGT, COST and broad apparel/footwear sourcing names. Administration likely appeals; ruling subject to higher-court review and potential stay.
OIL & GULF: BRENT TOPS $100 ON RENEWED GULF CLASHES, DIRECT HIT TO CONSUMER SENTIMENT
Renewed clashes between US and Iran in the Gulf — and a renewed UAE attack — pushed Brent ~1% higher to $101 with European stocks -0.9% and the STOXX 600 -0.9%. Multiple consumer broker notes today (MCD, WHR, TM) explicitly cite Iran/Middle East war as the proximate cause of negative April traffic, ~50-yr-low US consumer sentiment, and acute lower-income QSR pressure. Strait of Hormuz disruption remains the key tail risk for autos, leisure, cruises, and broader discretionary spend.